How to Read a Soil Test Report

A soil test report arrives as a stack of pages with gradation curves, a plasticity chart, dry density numbers, and a classification symbol like CL or SM-SC. Most people on a jobsite read the summary page, look for a passing or failing stamp, and file the rest. The numbers on the other pages are what decide how much fill has to be moisture-conditioned, whether the borrow material is acceptable, and how much the earthwork will actually cost.
This is a guide to reading those numbers the way a contractor would. It covers what each laboratory test measures, which report value drives which field decision, and how to spot a report that is answering a different question than the one the job asked. If you are starting from the report as a whole, what is a geotechnical report explains how borings, sampling, and recommendations fit together.
The Tests Behind the Numbers
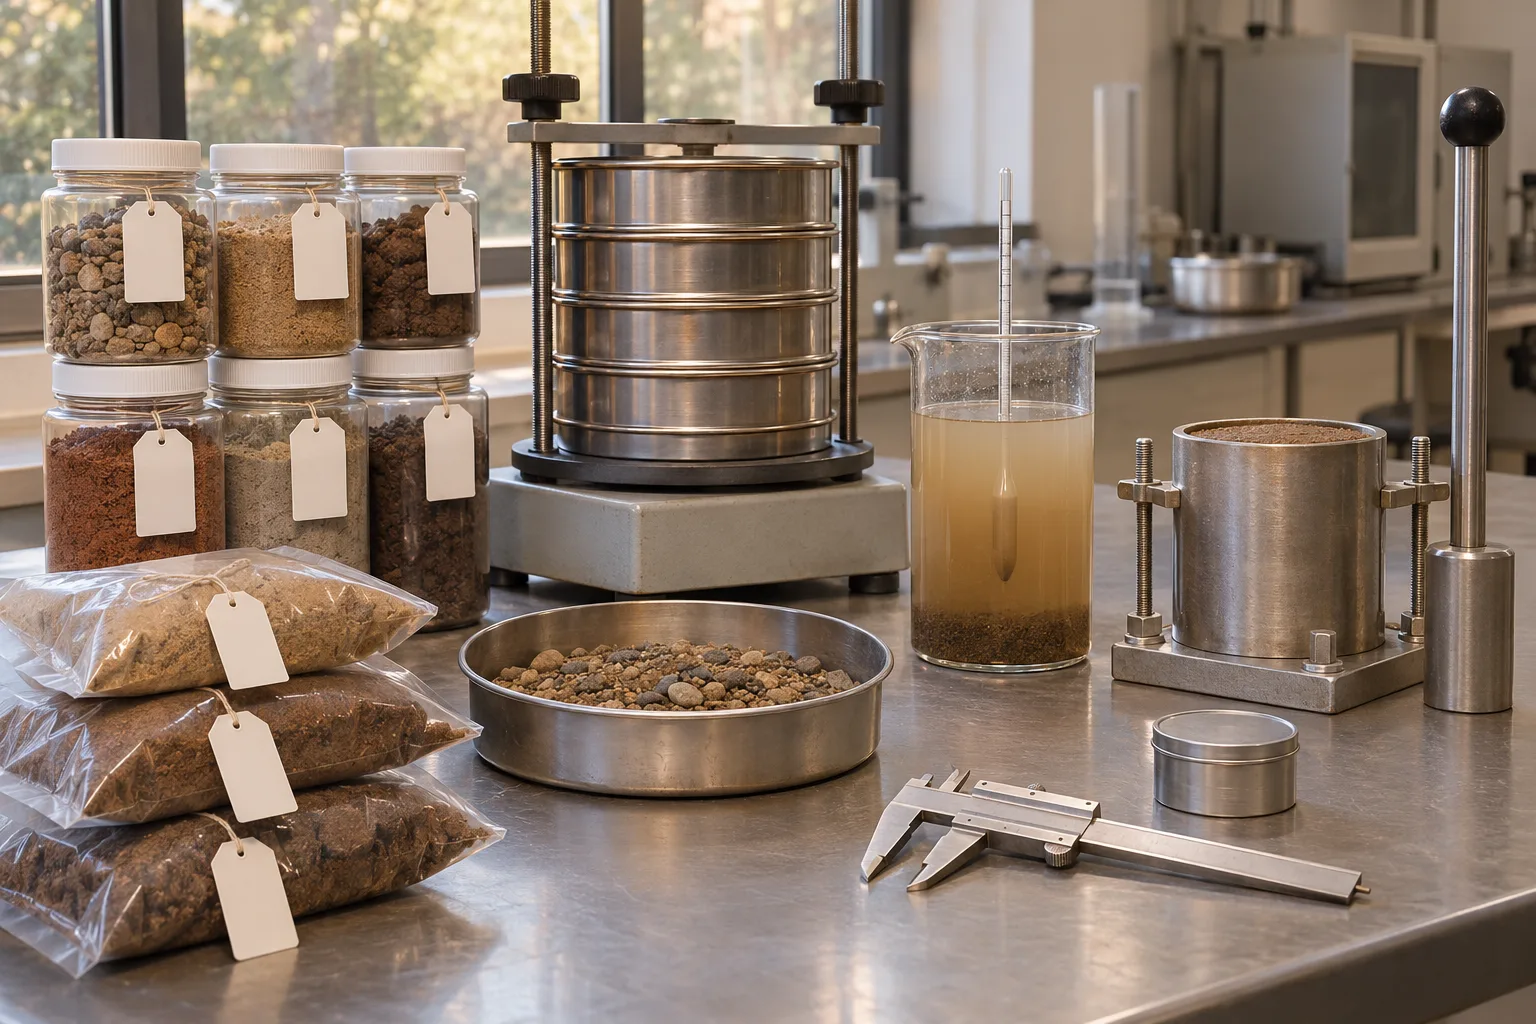
Nearly every soil report draws on a small set of standard tests. Gradation comes from a sieve analysis, with a hydrometer analysis added for the fine fraction. Plasticity comes from the Atterberg limits. Compaction characteristics come from a Proctor test, and strength for pavement design usually comes from a California Bearing Ratio test. Organic content and chemical tests are added when the project has a reason to care.
Each result should name the standard it was run under, such as ASTM D6913 for sieve analysis, D7928 for hydrometer analysis, D4318 for Atterberg limits, D2487 for classification, D698 or D1557 for compaction, D1883 for CBR, and D2974 for organic content. A report that gives numbers without the method is hard to enforce, because the same soil tested under a different method produces a different answer.
Gradation: What the Sieve Stack Actually Says
A sieve analysis reports the percentage of the sample passing each sieve in a stack. The percent passing the No. 200 sieve, the 0.075 millimeter opening, is the single most important number in the table, because it separates coarse-grained soil from fine-grained soil. If 50 percent or more of the material passes the No. 200, the soil is fine-grained; if more than 50 percent is retained on it, the soil is coarse-grained.
For gravels and sands, two shape values describe the curve. The coefficient of uniformity is D60 divided by D10, and the coefficient of curvature is D30 squared divided by D10 times D60. Well-graded gravel requires a uniformity coefficient of at least 4 with a curvature between 1 and 3; well-graded sand requires a uniformity coefficient of at least 6 with the same curvature band. A curve that is nearly vertical is uniform, and a curve with a flat shelf in it is gap-graded, which is a red flag for both compaction and drainage.
Practically, gradation tells you whether a borrow material will compact into a dense, stable mass or stay loose, and whether it will drain. A base aggregate that is gap-graded can pass a passing percentage on paper and still pump under load.
Atterberg Limits: The Plasticity Story
The liquid limit is the moisture content at which a standard groove cut in a remolded sample closes over a distance of about half an inch at 25 blows of the liquid limit device. The plastic limit is the moisture content at which a thread of soil rolled by hand crumbles at about one eighth of an inch in diameter. The plasticity index is simply the liquid limit minus the plastic limit, and it describes the range of moisture over which the soil behaves plastically.
The plasticity chart is where those numbers become a classification. The A-line is defined as plasticity index equals 0.73 times the liquid limit minus 20, and soils plotting above it behave as clays while soils below it behave as silts. A high plasticity index means the soil holds water, swells, shrinks, and is difficult to dry back to a workable moisture; a plasticity index near zero means the material is essentially non-plastic and will not hold together when wet.
For an excavation contractor, plasticity predicts trouble. Highly plastic clay is the material that will not reach compaction density without days of drying, that heaves under a slab, and that turns a borrow source into a scheduling problem. The behavior and the fix are covered in expansive clay soil and foundations.
The Classification Symbol: CL, SC, GP-GM, and What It Means
The report will assign a Unified Soil Classification System symbol, and sometimes an AASHTO group as well. The symbol is a shorthand for the gradation and plasticity results combined, and it is the fastest way to compare a proposed borrow material against a specification.
- G and S are gravel and sand, with a second letter for the fines: M for silt, C for clay, W for well-graded, P for poorly graded.
- M and C are silt and clay, with L, I, or H for low, intermediate, or high plasticity.
- Dual symbols such as CL-ML or SM-SC mean the soil sits near a boundary and has properties of both groups.
- PT is peat, material with more than 50 percent organic content that is unsuitable as fill or support.
The symbol is a summary, not a verdict. A CL that is stiff and dry can be excellent fill; the same CL at high moisture is a compaction problem. That is why the report also gives moisture contents and compaction data, and why identifying soil types on a jobsite is still a useful field skill alongside the lab result.
The Proctor Curve: Density, Moisture, and Which Test Was Run
Compaction test results are reported as a curve of dry density against moisture content, with a peak at the optimum moisture content. That peak is the maximum dry density for that material under that test method, and it becomes the reference for every field density test on the job.
The method matters enormously. A standard Proctor test applies roughly 12,400 foot-pounds per cubic foot of compactive energy, while a modified Proctor applies about 56,250. The modified test produces a higher maximum dry density at a lower optimum moisture, so a specification calling for 95 percent of a modified Proctor is a materially harder requirement than 95 percent of a standard Proctor on the same soil.
Read the report for three things: which method was run, what the maximum dry density and optimum moisture are, and whether an oversize correction was applied for gravel content. Then compare that to the specification. Most earthwork specifications require something on the order of 95 percent of maximum dry density within a narrow moisture band of optimum, and the field test is only meaningful if it references the same curve. For how the field side works, see how is soil compaction tested.
CBR and Strength: What the Number Is Used For
The California Bearing Ratio compares the load required to push a piston a set depth into a compacted, usually soaked, specimen against the load required for a standard crushed stone. It is reported as a percentage, and it is the input that pavement designers use to pick a pavement thickness. A CBR of 3 is weak, 6 is moderate, and 9 or better is good in the bands used by common parking-lot design tables.
The CBR value in the report should be tied to a stated compaction level and moisture condition. A CBR measured at 95 percent of maximum dry density on a soaked sample is a design value; a CBR measured on a loose, dry sample is a laboratory curiosity. If the report does not say how the specimen was prepared, ask.
When the design CBR is low, the response is not automatically more pavement. It may be undercutting and replacing unsuitable material, stabilizing the subgrade, or improving drainage so the subgrade stays at the moisture content the design assumed. Soil stabilization for unstable subgrade covers those options.
Organic Content, Sulfates, and Expansion
Three additional tests decide whether material is usable at all. Organic content, usually by loss on ignition, identifies topsoil and peat that will compress, settle, and never compact properly. Sulfate testing matters where concrete will be placed in contact with the soil, because sulfates attack concrete and drive the exposure class selection in ACI 318. Expansion testing matters for clays that will move with moisture changes under slabs and pavements.
For an excavator, organic content is a stripping decision. Everything above the organic line comes off and goes to a stockpile for landscaping, not into a building pad. Sulfate and expansion results are design inputs that belong in the conversation with the engineer before the first lift is placed, not after the concrete is poured.
Using the Report in the Field
The report becomes a working document when it is used to accept or reject material, set moisture conditioning, and decide test frequency. A borrow source is accepted against the specification by comparing its gradation, plasticity, and classification to the required limits, then verifying that the material as placed reaches the required density.
Moisture conditioning is where the report earns its keep. If the optimum moisture is 14 percent and the borrow is arriving at 9 percent, water has to be added in the cut or on the lift, and the project needs to plan for that time. If it is arriving at 20 percent, the material needs to dry, which is slower, weather dependent, and often the real reason a fill schedule slips.
Test frequency should match the specification and the variability of the material. A uniform borrow source needs fewer tests than a pit that changes character across the face, and a report that shows wide scatter between samples is telling you to test more often, not less.
Red Flags in a Soil Report
- No test methods listed. Numbers without standards cannot be enforced or compared.
- A single sample for a large site. One boring cannot describe a subgrade that changes across the footprint.
- Compaction results with no moisture content. Density alone does not tell you whether the material is workable.
- CBR values with no stated specimen preparation. The design value depends on how the sample was compacted and soaked.
- Classification that conflicts with the gradation table. Check that percent passing the No. 200 is consistent with the symbol reported.
- No discussion of groundwater. A high water table changes excavation, dewatering, and the moisture the subgrade will sit at.
- Recommendations with no field verification plan. The report should say what to test and how often during construction.
A soil report is not paperwork to file after the bid. It is the specification behind the fill, the base, and the pavement section, and the numbers in it translate directly into crew hours, water trucks, and haul-off. Reading it properly is the difference between pricing the dirt you will actually move and discovering it in the first week. For the next step, the relationship between these lab values and the layers they support is covered in subgrade, subbase, and base course, and the reasons field tests fail despite good lab numbers are covered in why compaction tests fail.